DK1/DK2 Power Price Forecasting + Backtested Divergence Strategy
Can you build a trading strategy, using only free public data, around the gap between Denmark's day-ahead power price and the real-time imbalance price that settles after the fact? Nine notebooks, run in order, each answering one specific question: an honest negative result, the feature fix that turned it real, four independent rounds of skepticism (blind holdout, Combinatorial Purged CV, a second price zone, tail-risk stress-testing), and a structural discovery that the whole model had been trained at the wrong time resolution. Every negative result and correction along the way is reported in the notebooks, not smoothed over.
Notebooks
9
CPCV Splits Positive
15/15
Price Zones
DK1 + DK2
Data Source
100% Free
Two Models, On Purpose
The project ended up with two genuinely separate, independently-validated models, not one merged pipeline. They coexist because Denmark's day-ahead auction only started clearing every 15 minutes on 2025-09-30 — before that, only one position per hour was ever achievable, even though the underlying imbalance settlement has been 15-minute since 2023.
| Hourly model (01-08) | 15-min model (09) | |
|---|---|---|
| Tradeable window | 2022-01 onward (~4.5 years) | 2025-09-30 onward (~11 months) |
| Validation | Full gauntlet: walk-forward, blind holdout, CPCV, DK2 replication, tail-risk/EVT | Same full gauntlet, run independently at 15-min resolution |
| Edge size | Real, but smaller | Materially stronger — hourly averaging was hiding signal |
| Best for | Longest validated track record, one trade per hour | Quarter-hourly signals, post-2025-09-30 regime |
The Nine Notebooks
01Data Exploration
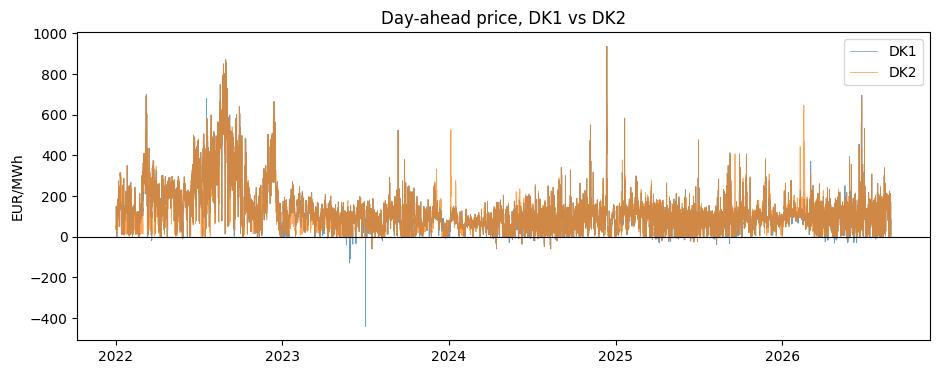
Methodology: Pulls DK1/DK2 day-ahead and imbalance prices from Energinet's free API and checks whether the series actually looks like a real power market before building anything on top of it: distribution shape, negative-price mechanics, daily/weekly seasonality, autocorrelation, and the DK1-DK2 spread.
Key finding: A real, volatile, occasionally-negative price series with a clear physical story (negative prices coincide with high wind + low demand), setting up exactly which features are worth engineering next.
02Day-Ahead Price Forecast
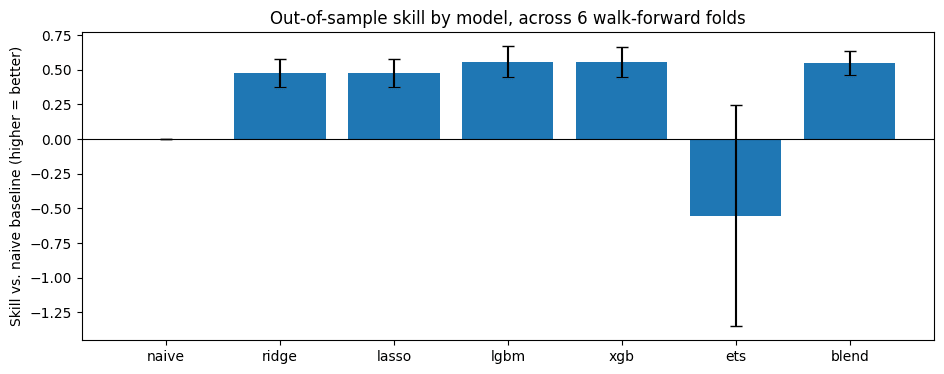
Methodology: Ridge, Lasso, LightGBM, XGBoost, and Holt-Winters exponential smoothing, combined into a weighted blend, evaluated with walk-forward (not shuffled) cross-validation against a seasonal-naive baseline.
Key finding: Strong, consistent skill: every tree/linear model beats naive by ~55% RMSE reduction, in every fold, not just on average.
03Imbalance Divergence Model
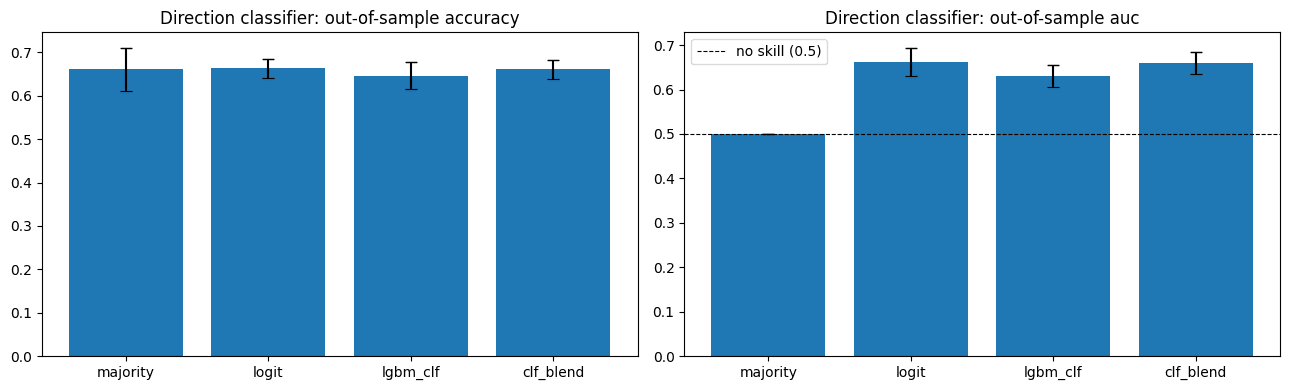
Methodology: Same model-family approach applied to the actual trading target: the gap between the day-ahead price and the real-time imbalance price. Adds a direction classifier track (logistic regression + LightGBM) scored on AUC, since the strategy only needs the sign right, not the exact magnitude.
Key finding: The first pass found zero skill, an honest negative result. Adding real-time regulation-state features (aFRR/mFRR activation, imbalance direction) that the original pipeline was silently discarding turned "no signal" into a real, statistically significant one.
04Backtest Strategy
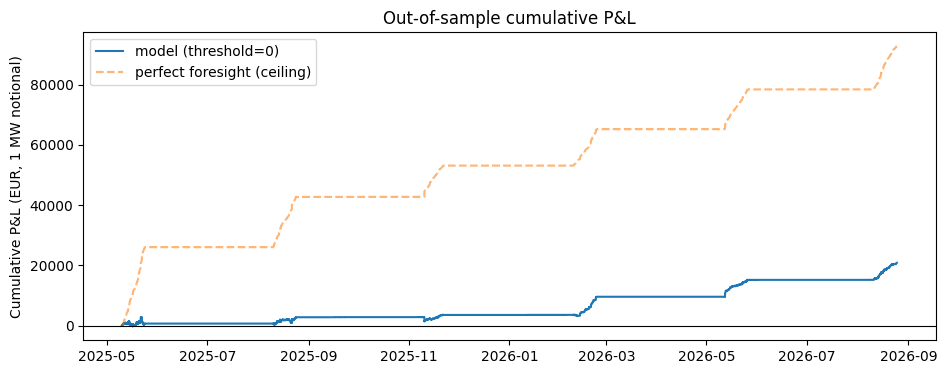
Methodology: Turns predicted divergence into a position (sign, proportional, or confidence-scaled sizing) and computes Sharpe, drawdown, hit rate, and a transaction-cost sensitivity sweep, since no published fee schedule exists for this exact settlement path.
Key finding: Backtest Sharpe jumped from a fragile 0.35 to ~10.5, large enough to be immediately suspicious, which is exactly what triggered the validation chain in notebooks 05-06 rather than being taken at face value.
05Holdout Validation
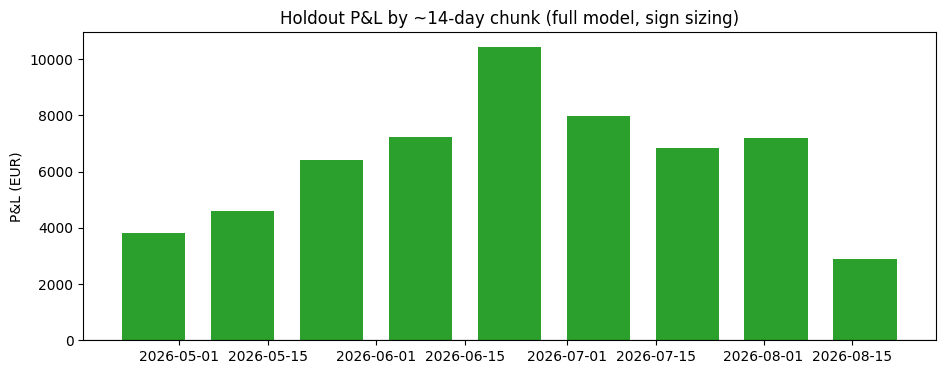
Methodology: A strictly sealed-off final 120 days, untouched by any exploration or feature-engineering decision made earlier in the project. Every model is fit once on development data and scored once on the holdout, no peeking, no second attempt.
Key finding: The edge held up and got stronger, not weaker (correlation 0.138 -> 0.283, Sharpe 10.5 -> 20.4) — the single strongest evidence available that a good backtest number is real rather than overfit.
06Combinatorial Purged Cross-Validation
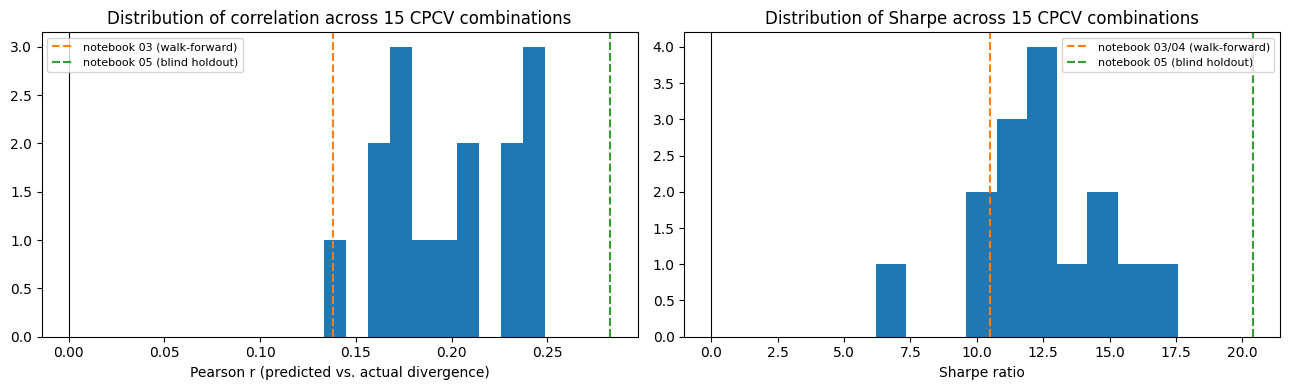
Methodology: Lopez de Prado's CPCV (Advances in Financial Machine Learning): instead of one train/test split, tests many different combinatorial train/test paths with proper embargo purging around each test block.
Key finding: 15 out of 15 purged combinations came back with positive correlation and positive Sharpe — the effect does not depend on which specific historical path is used to test it.
07DK2 Replication
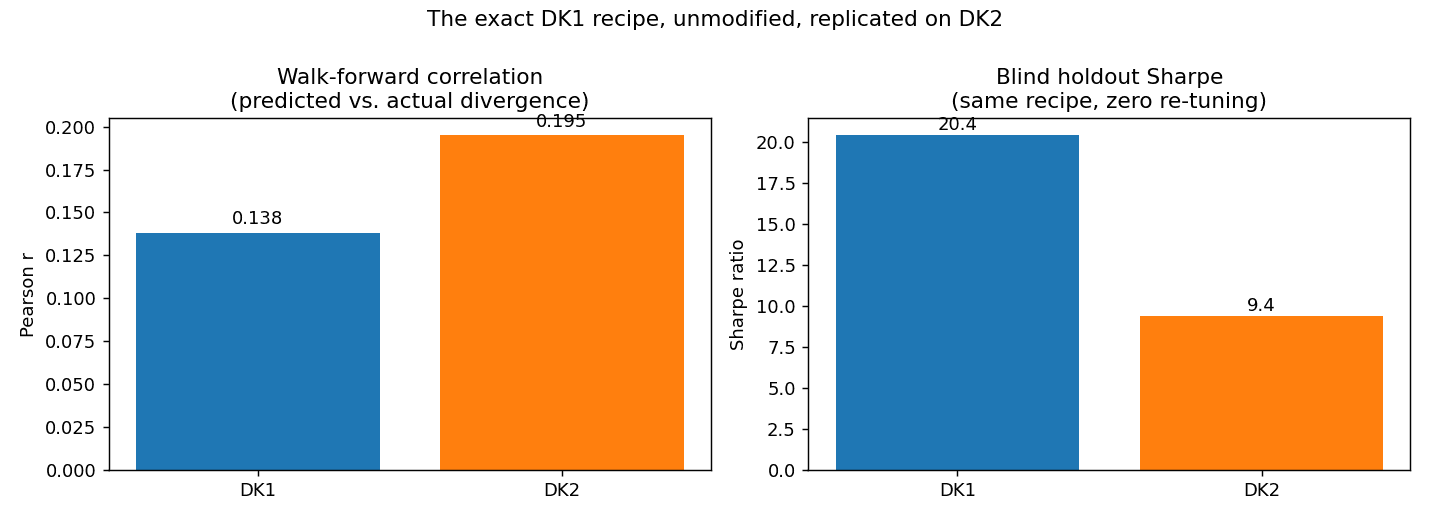
Methodology: The exact DK1-tuned recipe — same features, same hyperparameters, zero re-tuning — run unmodified on DK2, a physically different price zone (no direct Norway interconnector, different generation mix).
Key finding: Generalizes: DK2's walk-forward correlation (0.195) is actually stronger than DK1's (0.138), real evidence this is a structural property of the Nordic balancing market, not a DK1-specific artifact, though DK2's absolute Sharpe is lower and its edge is more concentrated in the classifier.
08Tail Risk
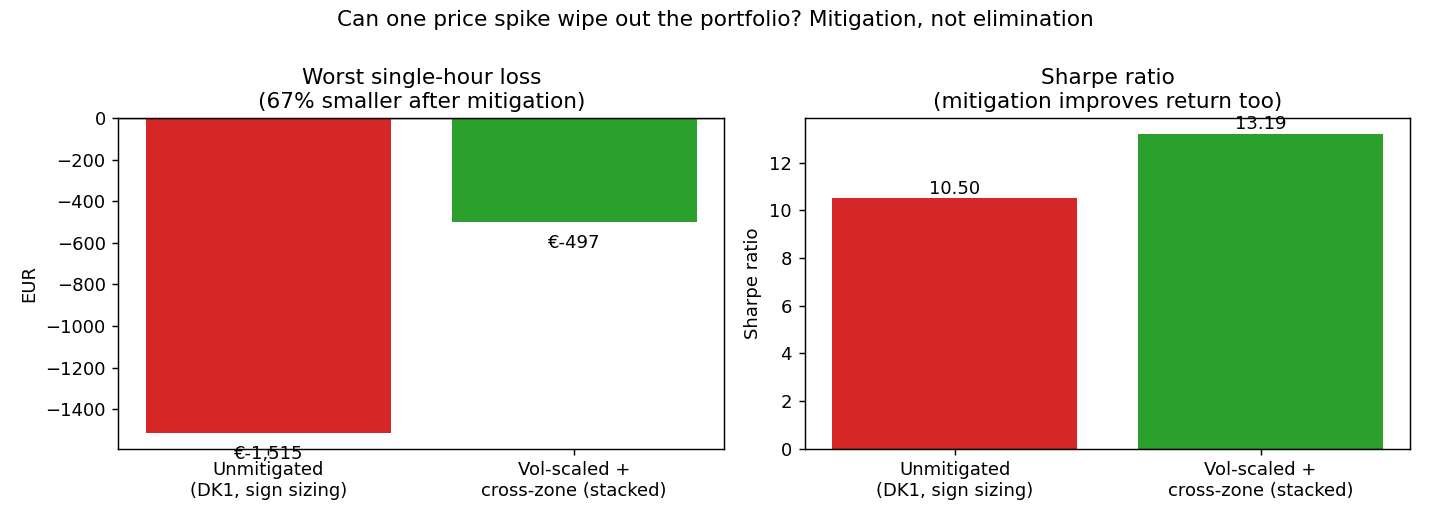
Methodology: Triggered by a professional energy trader's direct challenge: a good Sharpe doesn't rule out getting wiped out by one price spike. Adds VaR/CVaR/skew/kurtosis, tests volatility-scaled sizing and cross-zone diversification as mitigations, fits an Extreme Value Theory tail estimate, and tries four independent methods to predict shocks in advance.
Key finding: The concern was real: a single hour could lose 7% of the strategy's entire multi-year profit. Mitigations cut that worst hour by 67% while improving Sharpe. All four early-warning attempts (a statistical test, a candidate feature, a full ML classifier, high-resolution real-time data) failed to predict DK1's instantaneous shocks — strong evidence the risk is genuinely irreducible with public data.
09Native 15-Minute Divergence Model
Methodology: A live data check found Denmark's balancing market has actually settled every 15 minutes since 2023, not hourly — every earlier notebook had been trained on hourly averages of a finer-grained market. Rebuilds the model at native 15-minute resolution, extends training data through the full history, re-applies the tail-risk mitigations, checks transaction costs and probability of strategy failure, and refines a walk-backward causality test to isolate a calendar-window confound.
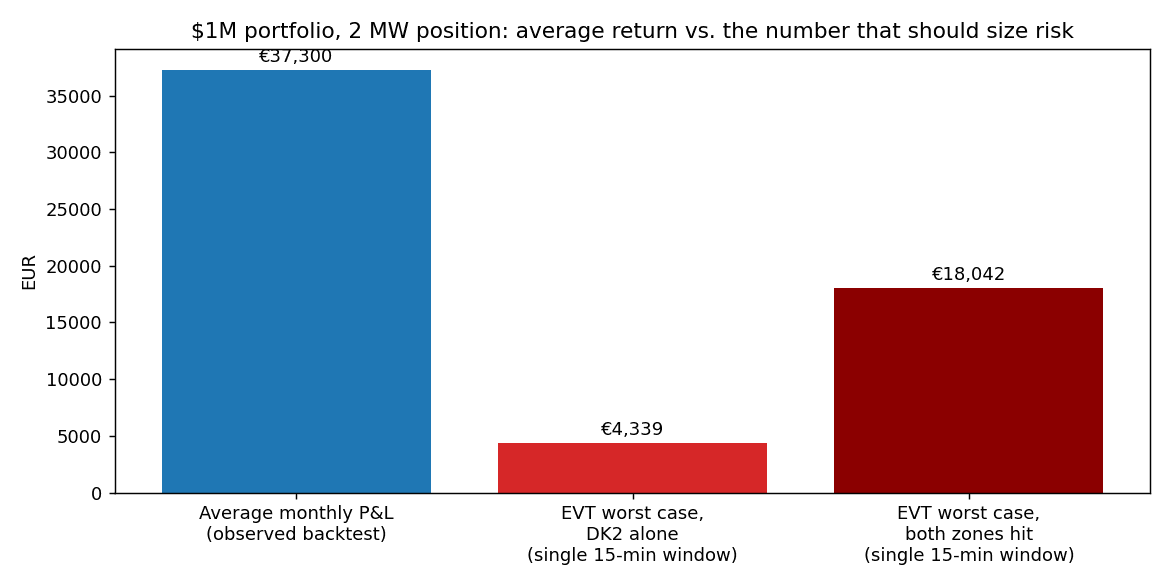
Key finding: A materially stronger edge than the hourly model — hourly averaging was hiding real signal, not manufacturing a false one. A $1M portfolio at a market-impact-safe position would average ~€37,300/month, but real risk-sizing should anchor to the Extreme-Value-Theory worst case (€4,300-18,000 in a single 15-minute window), 14-57x larger than anything the backtest's own limited history happened to show.
Does This Kind of Strategy Actually Work?
Trading the gap between the day-ahead price and the real-time imbalance price is a well-known idea in energy markets, but it's rarely tested this rigorously end to end on public data alone. The answer here is a qualified yes: the edge is real, not an artifact of one clever model or a lucky backtest window. It held up under a blind holdout, fifteen independently resampled test paths, and an unmodified replication in a second, physically different price zone. Its source is intuitive, too — grid imbalance is persistent minute to minute, so recent regulation activity is genuinely informative about what happens next, a real physical mechanism rather than a statistical coincidence.
But real doesn't mean free money. The same short-lag mechanism that makes the edge trustworthy also caps how large it can get before market impact takes over, and it comes bundled with real, structurally unavoidable tail risk: a handful of instantaneous price shocks that no amount of public data can currently predict in advance. A viable version of this strategy looks less like "find the signal, deploy it" and more like a risk-management discipline — sizing positions off the worst case a statistical tail model implies, not the best case a backtest happens to show.
The more interesting structural finding is about market microstructure, not modeling. Rebuilding the same strategy at the market's actual 15-minute settlement resolution, instead of the hourly averages this project started with, revealed a meaningfully stronger edge than the coarser view ever showed. Hourly aggregation wasn't just imprecise, it was actively destroying signal that the real-time market carries. That's a broader lesson for modeling any market that settles faster than the data conventionally used to study it: the resolution you choose isn't a neutral implementation detail — it can determine whether you find the edge at all.